
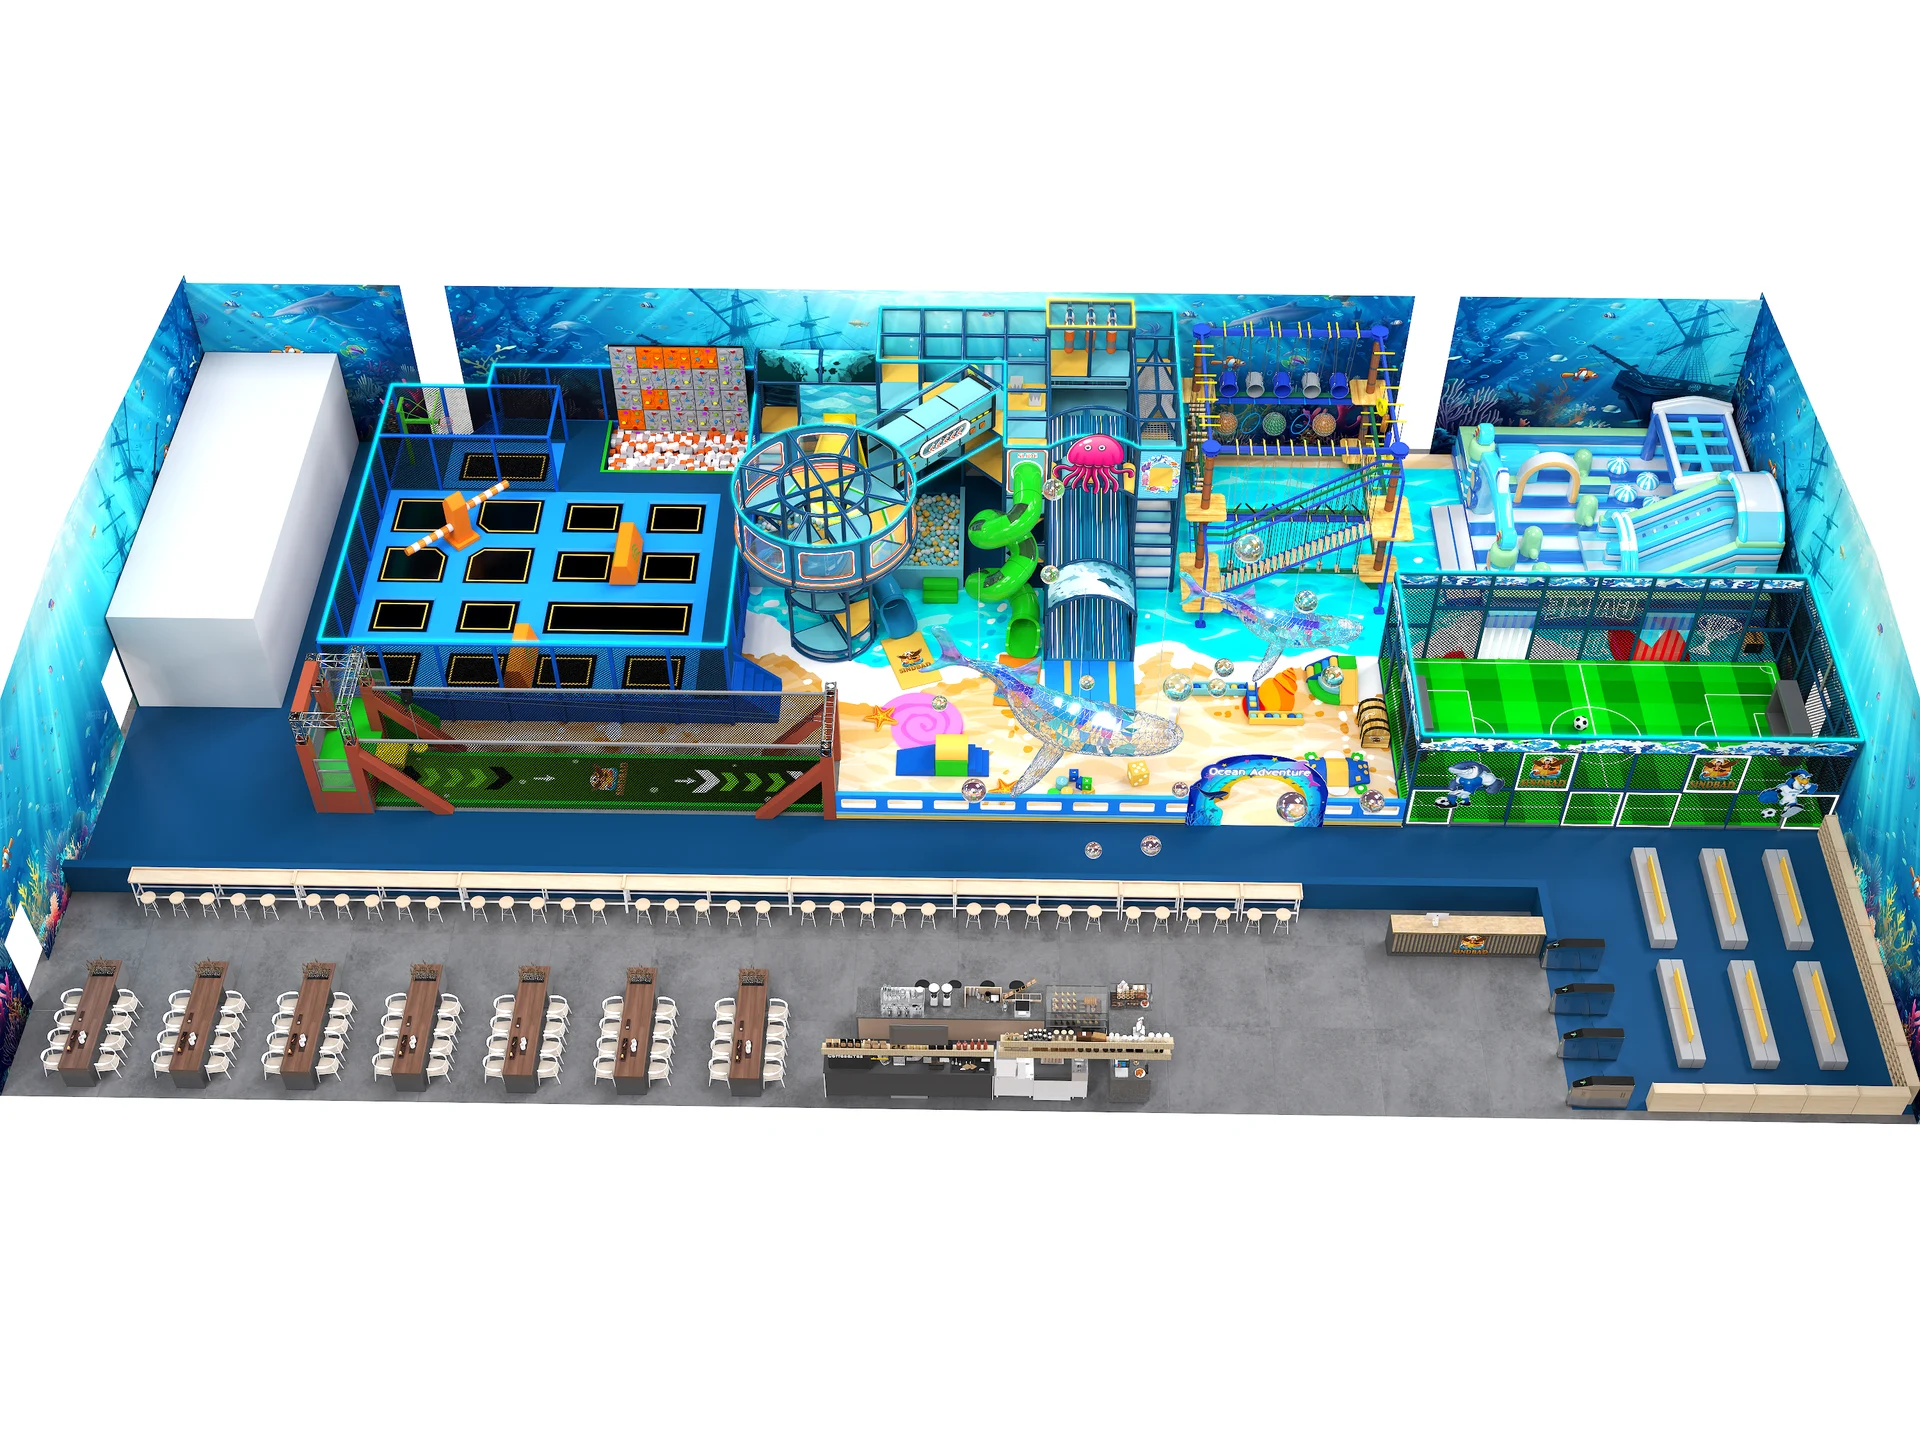
Macroeconomic Drivers: Why Indoor Entertainment Is Outperforming Leisure Benchmarks
The global Family Entertainment Center (FEC) sector continues to demonstrate resilient compound annual growth, expanding at over 10.4% CAGR through 2026. Despite shifting consumer discretionary spending, parental allocation toward children’s experiential activities, active play, and social milestone celebrations remains virtually inelastic across North America, Europe, the Middle East, and Southeast Asia.
Modern parents are consciously choosing active indoor play spaces over screen-bound entertainment. Furthermore, year-round climate realities—such as extreme summer heat in the GCC, extended monsoon rains in Southeast Asia, and sub-zero winter temperatures across North America and Northern Europe—position climate-controlled indoor entertainment venues as non-negotiable community infrastructure.
CapEx Benchmarks and Revenue Productivity Per Square Meter
Accurate financial underwriting begins with realistic capital expenditure modeling. Based on project delivery data across 70+ countries, Dream Garden categorizes commercial venue investments into three distinct density tiers:
- Standard Commercial Tier ($180 – $260 / m² Equipment CapEx): Ideal for regional strip centers and suburban family cafes. Includes dual-level play mazes, ball pools, interactive projection walls, and standard foam padded obstacles.
- Premium Multi-Attraction FEC ($280 – $420 / m² Equipment CapEx): The industry benchmark for shopping mall flagships (800–2,000 m²). Integrates 3-to-4 level vertical labyrinths, stainless steel spiral tube slides, interconnected trampoline arenas with slam dunk lanes, and ninja warrior challenge courses.
- Mega Destination / Adventure Park ($450 – $650+ / m² Equipment CapEx): Large-scale 2,000–5,000 m² destinations incorporating aerial high ropes courses, automated belayed climbing walls, roller gliders, and interactive gamified RFID scoreboards.
The 9 to 14 Month Payback Model: Deconstructing the Revenue Mix
How does a well-located 1,200 m² commercial indoor playground recoup its complete initial capital outlay in under 14 months? The secret lies in diversifying revenue streams away from reliance on weather-dependent walk-in tickets:
- General Admission (45–55% of Gross): Hourly and full-day passes priced with dynamic weekend premiums ($15–$28/child depending on regional purchasing power).
- Birthday Packages & Private Hire (25–35% of Gross): Fixed-margin party packages booked 4 to 8 weeks in advance, featuring 90 minutes of supervised play, private party room access, customized cake service, and merchandise packs ($350–$850 per 10-child party).
- Food & Beverage Concessions (12–18% of Gross): Premium coffee, healthy snacks, and children’s meal boxes yielding gross margins exceeding 65%.
- Retail, Grip Socks & Memberships (5–10% of Gross): Branded anti-slip safety socks ($3/pair, cost $0.50) provide a high-margin recurring annuity on every admission ticket sold.
Strategic Technology and Theming Trends for 2026–2028
Forward-thinking operators are future-proofing their venues by investing in three emerging trends: First, Gamified Active Play—integrating digital sensor targets and RFID wristbands that record children's climb times, obstacle course scores, and repeat visits. Second, Inclusive Sensory Integration—incorporating quiet decompression corners, wheelchair-accessible carousels, and tactile sensory panels designed for neurodiverse children. Third, Modular Structural Systems—selecting play equipment designed with modular structural connectors that allow seasonal activity rotations without discarding primary steel uprights.