


Please contact us!
En
At Dream Garden, we believe playgrounds are more than places to burn energy — they’re where confidence, coordination, and creativity begin to grow.
A well-designed play space helps children move freely, connect with others, and develop essential social and physical skills. Whether outdoors in local parks or indoors in community play centers, accessible playgrounds shape healthier, happier childhoods.
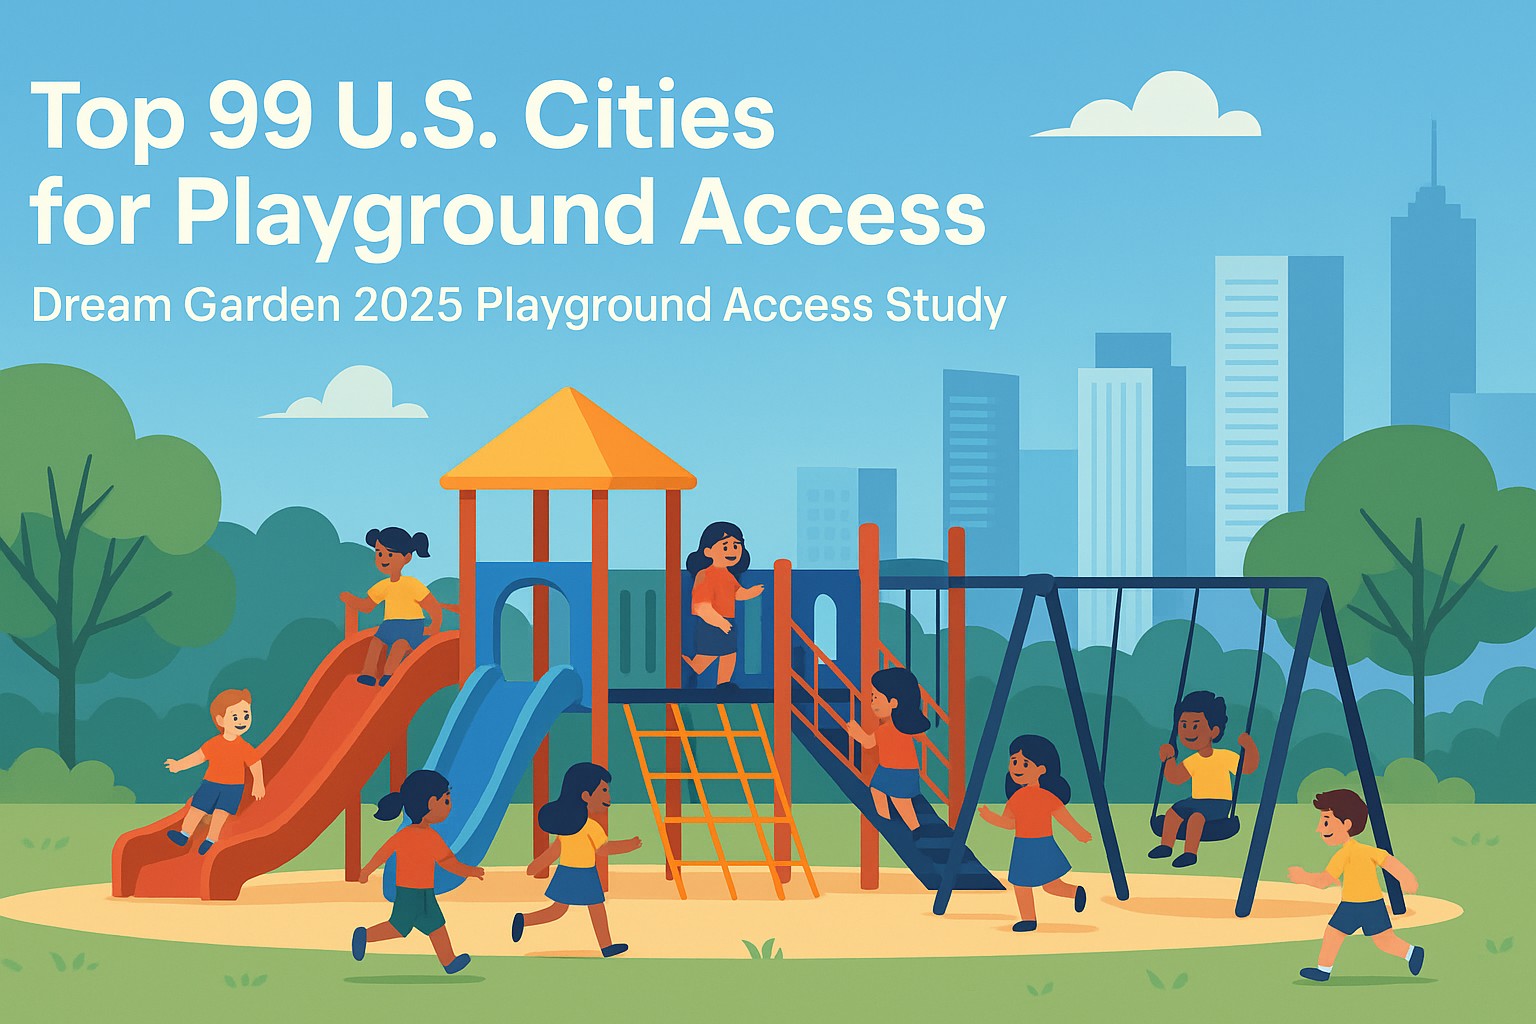
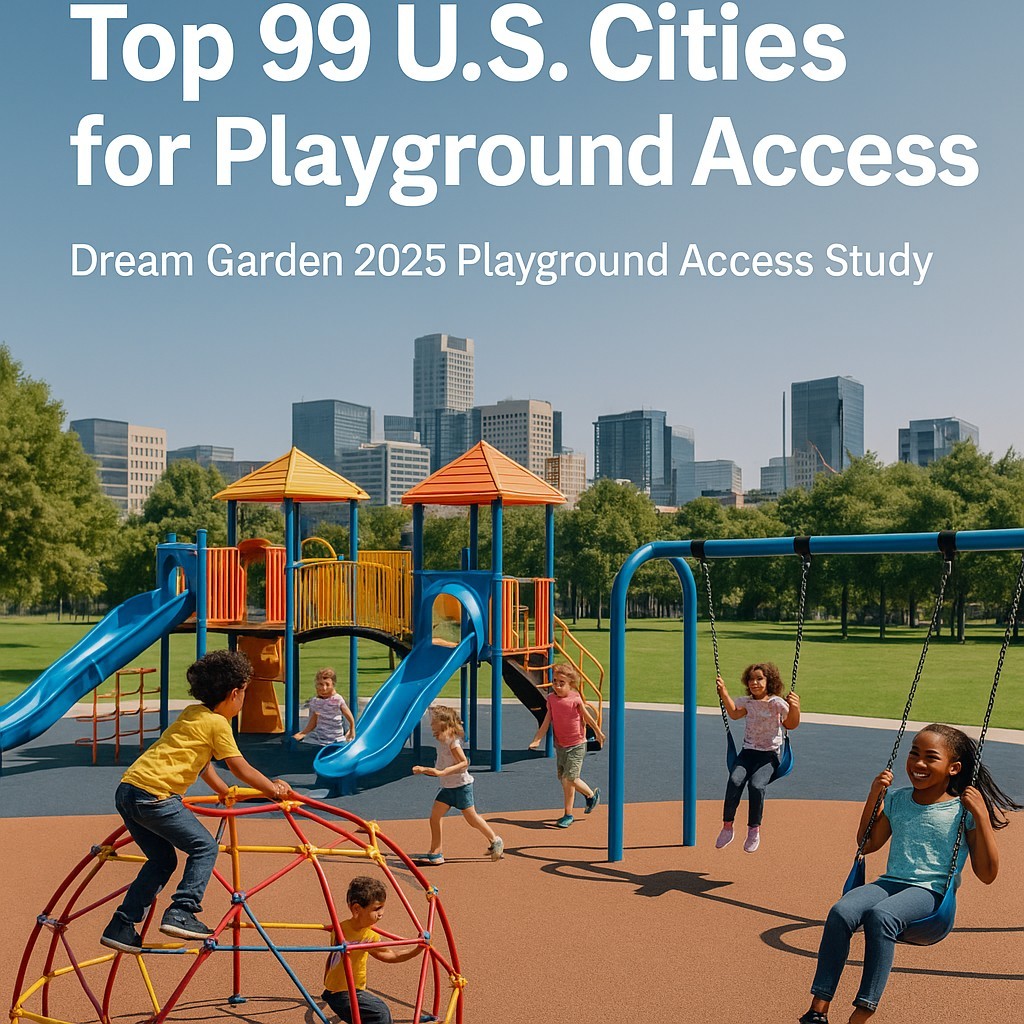
To understand how well U.S. cities make space for kids to play, Dream Garden analyzed 99 major cities, combining two indicators — playground density (per 10,000 children) and park walkability (residents within a 10-minute walk of a park) — into a single Playground Access Score.
Amid renewed U.S.–China tariff tensions, city planners, schools, and recreation centers are facing higher equipment costs and longer procurement timelines. These challenges, born from trade barriers, are reshaping how play spaces are designed and maintained.
Dream Garden’s latest research offers a timely look at how cities can safeguard childhood development and community health despite global market pressures. The results also connect to a broader question:
How can manufacturers adapt under the weight of 100%+ tariffs while ensuring children continue to play safely and freely?
According to Dream Garden’s 2025 analysis, Cincinnati, Las Vegas, and Madison lead the nation in playground accessibility.
The Playground Access Score blends availability (how many playgrounds per 10k children) with proximity (how many residents live within a 10-minute walk of a park).
Cincinnati, OH tops the list with nearly 48 playgrounds per 10k children and 91% walkable park access.
Las Vegas, NV surprises with the highest playground density in the U.S. (56 per 10k children).
Madison, WI ranks third, where 98% of residents live within a short walk of a park.
Other strong performers — Irvine, San Francisco, Sacramento, Minneapolis, Boston, Chicago, and Pittsburgh — show how urban design and public funding can make play more equitable, even in dense or cold-climate regions.
| Rank | City | Playgrounds (count) | Playgrounds per 10k children | Residents within 10-min walk (%) | Playground Access Score |
|---|---|---|---|---|---|
| 1 | Cincinnati, OH | 349 | 47.61 | 91 | 85.80 |
| 2 | Las Vegas, NV | 906 | 56.09 | 70 | 79.17 |
| 3 | Madison, WI | 192 | 32.6 | 98 | 76.58 |
| 4 | Irvine, CA | 220 | 28.53 | 94 | 69.98 |
| 5 | San Francisco, CA | 281 | 23.98 | 100 | 69.88 |
| 6 | Sacramento, CA | 346 | 27.14 | 89 | 65.21 |
| 7 | Minneapolis, MN | 175 | 19.42 | 99 | 64.91 |
| 8 | Boston, MA | 200 | 17.05 | 100 | 63.38 |
| 9 | Chicago, IL | 1033 | 18.33 | 98 | 63.20 |
| 10 | Pittsburgh, PA | 120 | 20.93 | 94 | 62.86 |
| 11 | Denver, CO | 276 | 18.73 | 96 | 62.18 |
| 12 | St. Paul, MN | 125 | 15.46 | 99 | 61.20 |
| 13 | Norfolk, VA | 165 | 30.62 | 78 | 60.83 |
| 14 | Milwaukee, WI | 278 | 17.9 | 95 | 60.71 |
| 15 | St. Louis, MO | 91 | 15.41 | 98 | 60.46 |
| 16 | Portland, OR | 261 | 21.89 | 89 | 60.28 |
| 17 | Seattle, WA | 157 | 12.48 | 99 | 58.40 |
| 18 | Washington, DC | 147 | 11.23 | 99 | 57.23 |
| 19 | Oakland, CA | 167 | 18.96 | 88 | 56.84 |
| 20 | New York, NY | 1926 | 10.75 | 99 | 56.78 |
| 21 | Lincoln, NE | 138 | 18 | 89 | 56.64 |
| 22 | Richmond, VA | 108 | 22.26 | 81 | 55.08 |
| 23 | Atlanta, GA | 218 | 21.27 | 82 | 54.84 |
| 24 | Albuquerque, NM | 183 | 14.53 | 91 | 54.77 |
| 25 | Jersey City, NJ | 36 | 5.48 | 100 | 52.53 |
| 26 | Spokane, WA | 86 | 15.61 | 86 | 52.31 |
| 27 | Plano, TX | 130 | 19.15 | 81 | 52.16 |
| 28 | Cleveland, OH | 115 | 13.54 | 88 | 51.76 |
| 29 | Miami, FL | 97 | 12.22 | 89 | 51.21 |
| 30 | Philadelphia, PA | 275 | 7.69 | 95 | 51.13 |
| 31 | Buffalo, NY | 81 | 11.39 | 90 | 51.13 |
| 32 | St. Petersburg, FL | 91 | 20.06 | 78 | 50.93 |
| 33 | Baltimore, MD | 133 | 10.96 | 88 | 49.34 |
| 34 | Boise, ID | 113 | 20.92 | 74 | 48.96 |
| 35 | Henderson, NV | 97 | 13.01 | 84 | 48.48 |
| 36 | Toledo, OH | 90 | 13.6 | 83 | 48.34 |
| 37 | Omaha, NE | 195 | 14.91 | 81 | 48.18 |
| 38 | Aurora, CO | 86 | 8.26 | 89 | 47.50 |
| 39 | Virginia Beach, VA | 245 | 22.66 | 69 | 47.12 |
| 40 | Corpus Christi, TX | 144 | 17.9 | 75 | 46.82 |
| 41 | San Jose, CA | 320 | 14.39 | 79 | 46.31 |
| 42 | Newark, NJ | 34 | 4.05 | 92 | 45.64 |
| 43 | Detroit, MI | 168 | 9.95 | 84 | 45.61 |
| 44 | Dallas, TX | 381 | 11.87 | 81 | 45.33 |
| 45 | New Orleans, LA | 101 | 12.05 | 80 | 44.81 |
| 46 | Anchorage, AK | 90 | 12.5 | 77 | 43.14 |
| 47 | Long Beach, CA | 81 | 8.22 | 82 | 42.60 |
| 48 | Arlington, VA | 168 | 15.99 | 71 | 42.25 |
| 49 | Arlington, TX | 168 | 15.99 | 71 | 42.25 |
| 50 | Colorado Springs, CO | 137 | 11.43 | 77 | 42.14 |
| 51 | San Diego, CA | 222 | 7.71 | 81 | 41.43 |
| 52 | Reno, NV | 77 | 12.02 | 75 | 41.31 |
| 53 | Chula Vista, CA | 100 | 13.89 | 70 | 39.59 |
| 54 | Glendale, AZ | 74 | 10.84 | 73 | 38.81 |
| 55 | Stockton, CA | 75 | 8.03 | 75 | 37.56 |
| 56 | Chesapeake, VA | 175 | 26.63 | 49 | 36.95 |
| 57 | Orlando, FL | 62 | 8.55 | 72 | 35.97 |
| 58 | Kansas City, MO | 132 | 10.64 | 69 | 35.84 |
| 59 | Honolulu County, HI | 147 | 6.66 | 74 | 35.58 |
| 60 | Tulsa, OK | 139 | 13.05 | 64 | 34.63 |
| 61 | Austin, TX | 217 | 10.05 | 68 | 34.60 |
| 62 | Tucson, AZ | 137 | 11.29 | 66 | 34.37 |
| 63 | Fort Worth, TX | 253 | 8.96 | 69 | 34.27 |
| 64 | Fremont, CA | 47 | 8.09 | 70 | 34.15 |
| 65 | El Paso, TX | 208 | 11.85 | 64 | 33.51 |
| 66 | Frisco, TX | 50 | 7.1 | 70 | 33.22 |
| 67 | Irving, TX | 79 | 11.58 | 63 | 32.56 |
| 68 | Greensboro, NC | 108 | 14.54 | 59 | 32.56 |
| 69 | Santa Ana, CA | 36 | 4.56 | 72 | 32.23 |
| 70 | Lexington-Fayette County, KY | 102 | 12.99 | 60 | 31.80 |
| 71 | Chandler, AZ | 97 | 13.6 | 59 | 31.68 |
| 72 | Tampa, FL | 92 | 9.86 | 64 | 31.64 |
| 73 | Gilbert, AZ | 24 | 2.78 | 72 | 30.56 |
| 74 | Anaheim, CA | 60 | 7.36 | 65 | 29.99 |
| 75 | Houston, TX | 502 | 8.78 | 63 | 29.93 |
| 76 | Fresno, CA | 79 | 4.87 | 66 | 28.35 |
| 77 | Laredo, TX | 80 | 9.84 | 59 | 28.15 |
| 78 | Garland, TX | 41 | 6.34 | 63 | 27.64 |
| 79 | North Las Vegas, NV | 53 | 6.56 | 62 | 27.16 |
| 80 | Mesa, AZ | 75 | 5.79 | 63 | 27.13 |
| 81 | Los Angeles, CA | 393 | 4.99 | 62 | 25.68 |
| 82 | Durham, NC | 109 | 15.65 | 46 | 24.57 |
| 83 | Santa Clarita, CA | 55 | 9.7 | 51 | 22.46 |
| 84 | Wichita, KS | 85 | 8.11 | 51 | 20.97 |
| 85 | Lubbock, TX | 57 | 7.89 | 51 | 20.76 |
| 86 | Phoenix, AZ | 276 | 6.33 | 52 | 20.00 |
| 87 | Nashville-Davidson County, TN | 166 | 10.17 | 44 | 18.04 |
| 88 | Louisville-Jefferson County, KY | 210 | 14.06 | 38 | 17.52 |
| 89 | Raleigh, NC | 122 | 11.01 | 42 | 17.44 |
| 90 | Scottsdale, AZ | 39 | 10.54 | 41 | 16.31 |
| 91 | Bakersfield, CA | 132 | 10.54 | 41 | 16.31 |
| 92 | San Antonio, TX | 218 | 5.97 | 47 | 16.19 |
| 93 | Riverside, CA | 40 | 4.85 | 48 | 15.83 |
| 94 | Memphis, TN | 112 | 6.98 | 45 | 15.74 |
| 95 | Oklahoma City, OK | 139 | 7.35 | 40 | 12.62 |
| 96 | Jacksonville, FL | 236 | 9.96 | 35 | 11.60 |
| 97 | Charlotte-Mecklenburg County, NC | 195 | 6.7 | 39 | 11.32 |
| 98 | Winston-Salem, NC | 49 | 7.58 | 36 | 10.06 |
| 99 | Port St. Lucie, FL | 27 | 5.22 | 28 | 2.29 |
While playground access varies by city, a new challenge looms globally: the rising U.S. import tariffs on playground equipment, especially those from Chinese manufacturers.
The most recent 104% tariff on Chinese-made playground and recreation equipment has forced both exporters and U.S. buyers to rethink their strategies.
Rising tariffs drive up project costs for municipalities and schools, making large-scale installations harder to approve.
Longer lead times and unpredictable customs procedures delay deliveries, affecting park maintenance schedules and indoor center openings.
Manufacturers like Dream Garden are responding with modular, repairable, and material-efficient designs that reduce dependence on single-source imports.
U.S. cities with dense networks of local parks and community centers — such as those leading this ranking — are naturally more resilient. When play areas are close to home, families rely less on large commercial installations or imports, keeping community play accessible regardless of global trade trends.
This study builds on a series of Dream Garden analyses exploring how Chinese playground manufacturers adapt to shifting global trade realities:
How Chinese Indoor Playground Equipment Factories Transform Under 100% U.S. Tariffs
Will U.S. Sanctions and Tariff Threats Disrupt the Global Playground Equipment Supply Chain?
How We’re Navigating the 104% Tariff as a Chinese Manufacturer
Together, these articles illustrate how Chinese innovation is driving global supply-chain adaptation — not by lowering quality, but by raising design efficiency and sustainability.
“Every tariff creates a challenge — but also a reason to innovate,” says Stefan Zhang, Founder & CEO of Dream Garden.
“Our mission is to make play accessible to every child. Whether that happens through local parks or global partnerships, play should never be limited by policy.”
The 2025 ranking is based on data from the Trust for Public Land’s ParkServe database and the National Recreation and Park Association (NRPA).
Indicators analyzed:
The number of playgrounds per 10,000 children
The percentage of residents living within a 10-minute walk of a park
Both factors were normalized and averaged to produce the Playground Access Score, reflecting how easily families can reach safe play spaces.
As tariff pressures reshape the market, Dream Garden continues to explore how cities, educators, and manufacturers can collaborate to protect children’s right to play.
The key lies in accessibility, innovation, and global cooperation — values that transcend politics and borders.
Source: Dream Garden 2025 U.S. Playground Access Study
Website: www.toymakerinchina.com | www.playgroundinchina.com
Copyright Wenzhou Dream Garden Amusement Equipment Co.,Ltd | Sitemaps|Xml
|Please contact us!

